In February, we added 5 features to FleetFACTZ to improve the user experience. Read on to learn more!
Resource content export
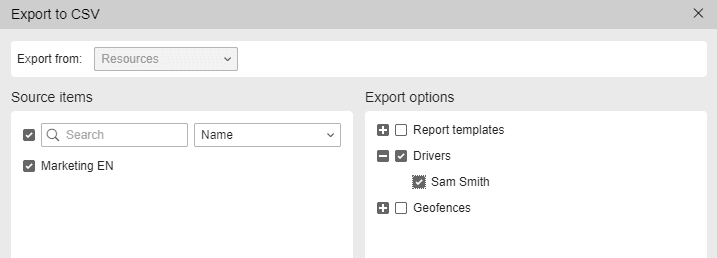
Previously, you could only export your unit and user lists from the account manager. Many of our users have the need to download other data from their account, so we added the ability to export certain resource content in .csv format:
geofences;
jobs;
notifications;
drivers;
report templates.
The new option will eliminate the need to manually copy the necessary information and help save time and effort. Now you can download the resource content by choosing the import/export option in your user menu (accessible by clicking on your user ID) and selecting 'Export to CSV'.
Application example: Export the list of drivers with their names and phone numbers to be able to contact them fast without logging in to the system. It also helps to retain HOS driver IDs and ibutton IDs.
New format of the exported report filename
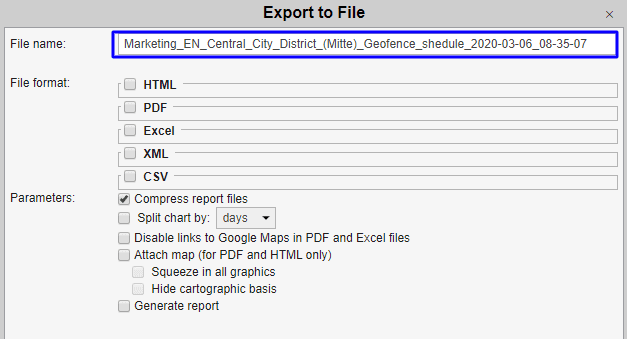
Earlier, when exporting a report to file by the resource item (driver, trailer, geofence, etc.), there was no item name anywhere.
Now, the exported report filename will contain not only the resource name but also the item (unit, group, or driver) name. Thus, when exporting several reports, their files now have different names. It allows choosing the right file without the need to open it. This is available when you execute a report in the reports panel and choose the 'Export to File' to file button.
New Charts & Tables in Dashboard
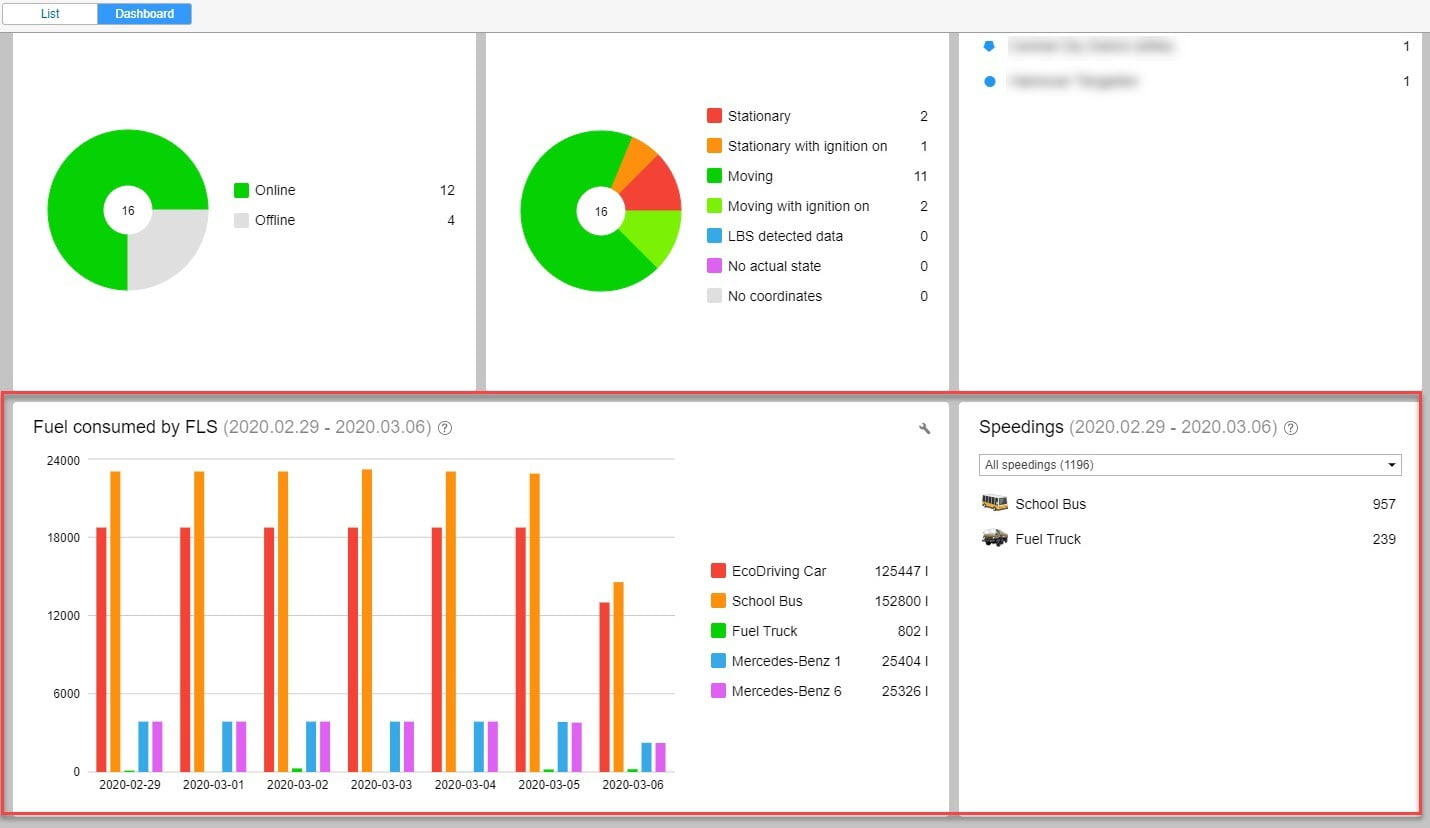
On the Dashboard tab, we added new charts & tables with:
information on consumed fuel (by Fuel Level Sensor) – the chart shows how much fuel was consumed over the past seven days, according to the Fuel Level Sensor*;
information on speeding – the table displays information about the number of speeding incidents in different categories over the past seven days in accordance with the "Road limits" detection method.
*Note: Fuel Consumption data in this dashboard is only available for units with Fuel Level Sensors. Contact your Service Provider for more details.
Configure Dashboard
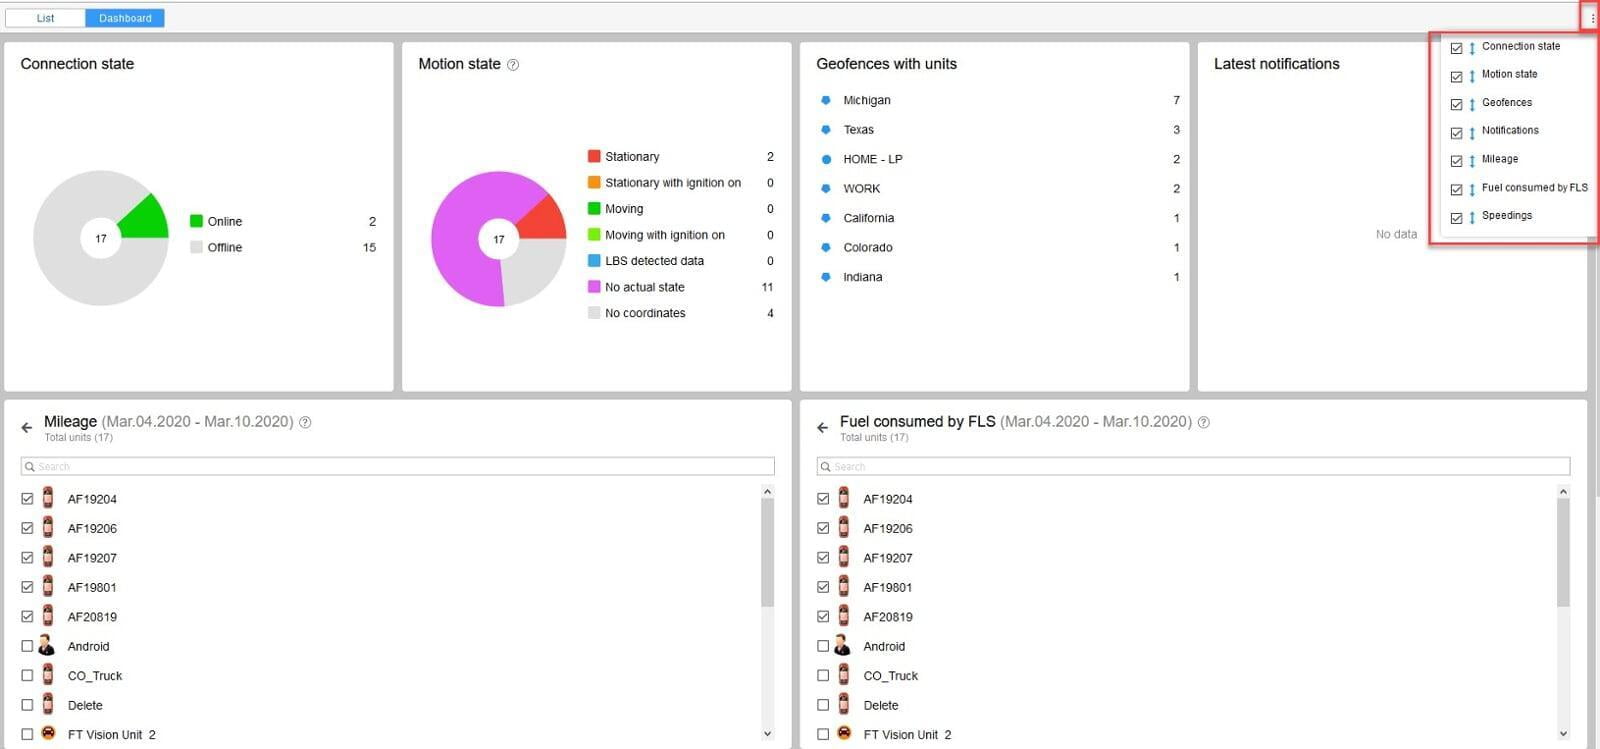
Previously, you could not configure which charts and tables are visible in the Dashboard view. Now users can decide which charts & tables they want to view, giving you more control over your data. To select which blocks are visible, select the Dashboard settings menu (![]() ) in the upper right corner and select the items you want to view. You can also rearrange the order of the charts and tables by dragging and dropping the items in the order you want to see them.
) in the upper right corner and select the items you want to view. You can also rearrange the order of the charts and tables by dragging and dropping the items in the order you want to see them.
Displaying unit properties in reports
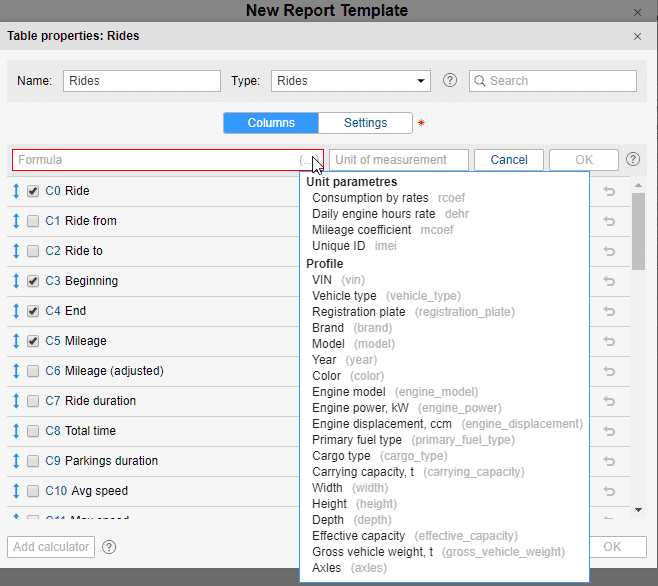
We added the ability to display certain unit properties in reports. For example, it might be important to add vehicle year, make, model & VIN to an upcoming maintenance report. You can add the unit profile information to any report by opening the table properties and using the add calculator button. Then click on the parenthesis (...) to view the list of parameters you can add to the report.
If you'd like more information or training regarding these updates, please contact our Customer Support department.
